How to Use the MACD Indicator for Crypto
By Jason Miller – Crypto Writer 10.expert 🧠 Covering Bitcoin, altcoins, blockchain & Web3.
As a crypto writer and analyst, I’ve found that navigating the complexities of market momentum is crucial for effective trading. While raw price charts provide the “what,” technical indicators often explain the “how fast” and “how strong.” Among the most powerful momentum indicators in a trader’s arsenal is the Moving Average Convergence Divergence (MACD).
The MACD isn’t just about identifying trends; it’s about understanding the strength and direction of those trends, as well as detecting potential shifts before they fully manifest in price. For crypto traders, where volatility can be both a blessing and a curse, the MACD offers a vital lens through which to view market psychology.
Let’s break down how you can effectively use the MACD indicator in your crypto trading.
How to Use the MACD Indicator for Crypto: Decoding Market Momentum 📊🚀
The MACD is a trend-following momentum indicator that shows the relationship between two moving averages of an asset’s price. It’s composed of three main components, each offering unique insights into market dynamics.
Understanding the MACD Components: MACD Line, Signal Line, Histogram 🧩
The MACD indicator typically consists of:
* MACD Line (Fast Line): Usually blue, this is calculated by subtracting the 26-period Exponential Moving Average (EMA) from the 12-period EMA. It represents the shorter-term momentum.
* Signal Line (Slow Line): Usually red, this is a 9-period EMA of the MACD line itself. It acts as a trigger for buy/sell signals.
* Histogram: Bars plotted above or below the zero line, representing the difference between the MACD line and the Signal line. It visually depicts the momentum’s strength.
Adding MACD to Your Chart: Getting Setup 💻
On most crypto trading platforms (like TradingView, Binance, Bybit, Kraken), you can easily add the MACD indicator. Navigate to the “Indicators” or “Studies” section and search for “MACD.” It will usually appear in a separate panel below your main price chart. The default settings are typically 12, 26, 9 (12-period EMA, 26-period EMA, 9-period signal line EMA).
The Signal Line Crossover: Your Primary Buy/Sell Signal 🚦
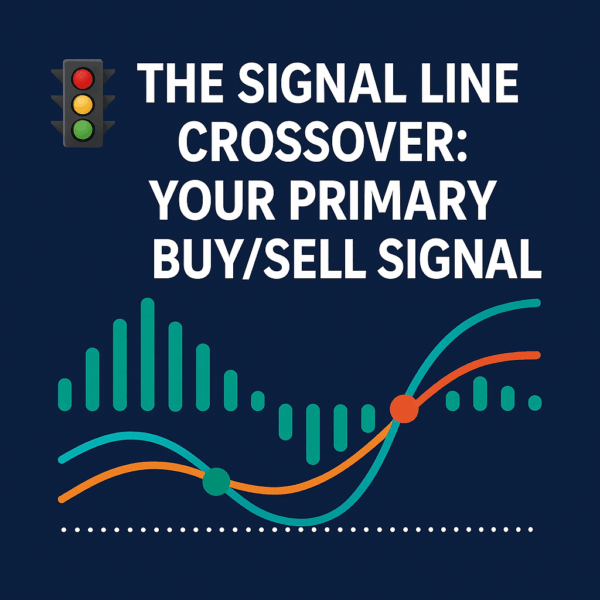
This is the most common and often the first signal traders look for:
* Bullish Crossover (Buy Signal): When the MACD line crosses above the Signal line. This indicates a shift to bullish momentum and a potential buying opportunity.
* Bearish Crossover (Sell Signal): When the MACD line crosses below the Signal line. This suggests a shift to bearish momentum and a potential selling opportunity or signal to exit long positions.
The Zero Line Crossover: Confirming Trend Direction ➡️
The MACD indicator oscillates above and below a central zero line. This line is crucial for understanding the overall trend bias:
* MACD above Zero Line: Generally indicates bullish momentum and an overall uptrend.
* MACD below Zero Line: Generally indicates bearish momentum and an overall downtrend.
A crossover of the MACD line across the zero line can signal a major shift in the longer-term trend.
Interpreting the Histogram: Momentum Strength and Anticipation 📊
The histogram provides visual cues about momentum:
* Growing Histogram Bars (in the direction of the trend): Indicate increasing momentum (e.g., growing positive bars in an uptrend, growing negative bars in a downtrend).
* Shrinking Histogram Bars (in the direction of the trend): Indicate weakening momentum, suggesting the current trend might be losing steam and a reversal or consolidation could be near. This can be an early warning sign before a signal line crossover.
* Histogram Crossover of Zero: Reflects the MACD line crossing the Signal line.
Divergence: The Forewarning of Reversal 📉📈
MACD divergence is one of its most powerful signals, as it can forewarn a potential trend reversal:
* Bullish Divergence: Price makes a lower low, but the MACD makes a higher low. This suggests that selling pressure is weakening, and a reversal to the upside might be coming.
* Bearish Divergence: Price makes a higher high, but the MACD makes a lower high. This indicates that buying pressure is fading, and a reversal to the downside might be imminent.
Always confirm divergence with other signals or price action.
Hidden Divergence: Confirming Trend Continuation ➡️
Less discussed but equally useful are hidden divergences, which can confirm the continuation of an existing trend:
* Hidden Bullish Divergence: Price makes a higher low, but MACD makes a lower low. This suggests underlying strength in an uptrend.
* Hidden Bearish Divergence: Price makes a lower high, but MACD makes a higher high. This suggests underlying weakness in a downtrend.
MACD in Trending Markets vs. Ranging Markets 🎯
The MACD performs best in trending markets. In strong trends, it can keep you in a trade. However, in ranging or sideways markets, the MACD can generate many false signals (whipsaws) as the lines cross frequently around the zero line. It’s crucial to confirm trend direction using other indicators or price action before relying solely on MACD signals.
Multiple Timeframe Analysis with MACD 🕰️
For more robust signals, use MACD across different timeframes:
* Check a higher timeframe (e.g., daily) to determine the overall trend direction and confirmation.
* Then, look for MACD signals on a lower timeframe (e.g., 4-hour or 1-hour) that align with the higher timeframe’s direction. This helps filter out noise and increases conviction.
Customizing MACD Settings: Adjusting Sensitivity ⚙️
While (12, 26, 9) is standard, you can adjust the parameters:
* Shorter EMAs (e.g., 5, 10, 5): Makes the MACD more sensitive and provides faster signals (good for very short-term trading/scalping, but more whipsaws).
* Longer EMAs (e.g., 20, 40, 10): Makes the MACD smoother and less reactive, reducing noise (better for longer-term trend analysis).
Experiment with different settings based on the crypto’s volatility and your trading style.
Combining MACD with Other Indicators for Confirmation 🤝
No single indicator should be used in isolation. Combine MACD with:
* RSI: To confirm overbought/oversold conditions (e.g., a bullish MACD crossover when RSI is oversold).
* Moving Averages: Use MAs (like 50 or 200 SMA/EMA) to confirm the overall trend; only take MACD signals that align with the MA trend.
* Volume: Increased volume supporting a MACD signal adds conviction (e.g., high buying volume on a bullish crossover).
MACD for Entry and Exit Points ➡️
- Entry: Look for bullish crossovers of the signal line or zero line for long entries.
- Exit: Look for bearish crossovers of the signal line or zero line for exiting long positions or entering short positions. Divergences can also signal early exits.
Risk Management: Always a Priority 🛡️
Regardless of the MACD’s signals, always apply strict risk management. Define your stop-loss and take-profit levels for every trade. The MACD can help you identify logical areas for these, but it doesn’t replace the need for them.
Avoid Trading During Flat MACD 📉
If the MACD lines are flat and hugging the zero line, and the histogram is very small, it indicates a low-momentum, choppy, or consolidating market. Avoid trading based on MACD signals during such periods as they are likely to be false.
Practice and Journaling 🧑💻
The best way to master MACD is through practice. Use a demo account or paper trading to apply different MACD strategies. Keep a detailed trading journal, noting down the MACD signals, your entry/exit, and the outcome. This helps you refine your understanding and strategy over time.
The MACD indicator is a powerful and versatile tool for crypto traders, offering deep insights into momentum, trend strength, and potential reversals. By understanding its components and signals, and by combining it with other analytical methods, you can significantly enhance your ability to make more informed and strategic trading decisions.


