How to Use TradingView for Crypto
By Jason Miller – Crypto Writer 10.expert 🧠 Covering Bitcoin, altcoins, blockchain & Web3.
As a crypto writer and analyst, TradingView is unequivocally the most powerful and versatile charting platform available to crypto traders and investors. While basic price charts are available everywhere, TradingView elevates your analysis to a professional level, offering a suite of tools that range from sophisticated technical indicators to social networking and custom script development.
In 2025, with the crypto market becoming increasingly mature and data-driven, simply looking at price movements isn’t enough. TradingView allows you to dissect market behavior, test strategies, and share insights with a global community. Whether you’re a day trader, a swing trader, or a long-term investor, mastering TradingView is essential for making informed decisions in the fast-paced world of digital assets.
Let’s dive into how to use TradingView for crypto like a pro.
How to Use TradingView for Crypto: Master Your Charts, Master Your Trades 📈📊
TradingView is an all-in-one platform for crypto analysis. Here’s how to harness its power for your trading and investment decisions.
Master the Chart Interface and Layouts 🖥️
- Symbol Search: Easily find any crypto pair (e.g., BTC/USDT, ETH/BTC) across various exchanges (e.g., Binance, Coinbase, Kraken, OKX) by typing in the search bar.
- Timeframes: Seamlessly switch between different timeframes (e.g., 1-minute, 5-minute, 1-hour, 4-hour, daily, weekly, monthly) to analyze short-term volatility and long-term trends.
- Chart Types: Beyond standard candlesticks, explore Heikin Ashi (for trend clarity), Renko, Line Break, or Point & Figure charts for alternative perspectives.
- Multiple Chart Layouts: For pro users, set up multiple charts on a single screen to simultaneously monitor different crypto pairs, timeframes, or even correlated traditional markets (like the DXY or S&P 500).
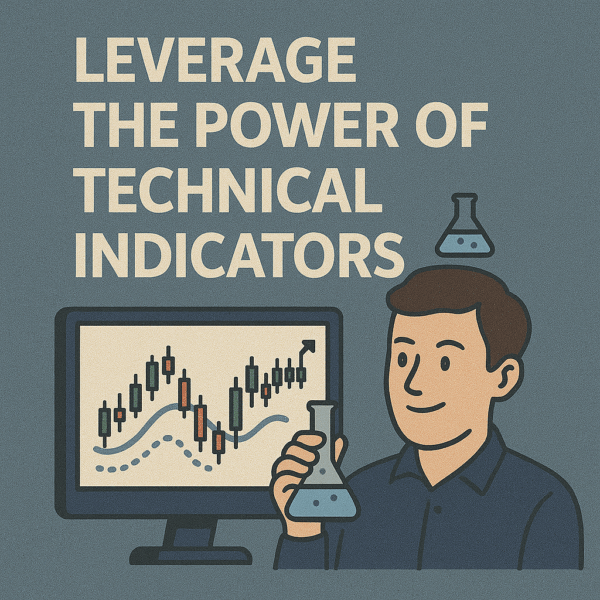
Leverage the Power of Technical Indicators 🧪

- Vast Library: Access hundreds of built-in indicators (RSI, MACD, Moving Averages, Bollinger Bands, Stochastic, Ichimoku Cloud, etc.) and over 100,000 community-created ones.
- Customization: Don’t just apply them; understand and customize their settings (periods, sources, styles) to fit your strategy and the specific asset you’re analyzing.
- Indicator on Indicator: For advanced analysis, apply an indicator to the output of another indicator (e.g., an RSI on a Moving Average).
Utilize Drawing Tools for Chart Analysis ✏️
- Trendlines & Channels: Draw precise trendlines to identify market direction and channels for potential price boundaries.
- Support & Resistance: Mark key horizontal support and resistance levels where price has historically reacted.
- Fibonacci Retracements & Extensions: Use Fibonacci tools to identify potential reversal levels or price targets based on market structure.
- Patterns & Annotations: Identify chart patterns (Head & Shoulders, Triangles, Flags) and use text, arrows, or shapes to annotate your analysis directly on the chart.
- Measurement Tool: Quickly measure price percentage changes, bar counts, and time durations between points.
Create and Manage Watchlists 🌟
- Organized Monitoring: Build custom watchlists to keep track of your favorite crypto assets, specific categories (e.g., Layer 1s, DeFi tokens), or projects you’re researching.
- Sync Across Devices: Your watchlists sync automatically between desktop and mobile apps, providing seamless access.
Set Smart Price Alerts 🔔
- Never Miss a Move: Set alerts for specific price levels, indicator crosses, drawing tool breaches, or custom conditions.
- Multiple Notification Methods: Receive notifications via app, desktop pop-up, email, sound, or even webhooks for automated systems. This is crucial for managing positions and catching opportunities without constant chart watching.
Explore the Crypto Screener 🕵️♀️
- Filter the Market: Use the crypto screener to filter thousands of cryptocurrencies based on various criteria (e.g., market cap, volume, exchange, price change percentage, technical indicator values like RSI overbought/oversold).
- Identify Opportunities: This powerful tool helps you quickly narrow down the market to find coins that fit your specific trading or investment criteria.
Leverage the Community & Social Features 🗣️
- Published Ideas: Explore “Ideas” published by other traders and analysts. This can provide different perspectives, validate your own analysis, or expose you to new trading setups.
- Community Scripts: Access a vast library of custom indicators and strategies created with Pine Script by the community. Many of these are incredibly powerful.
- Public/Private Chats: Engage in real-time discussions with other traders in public chatrooms or form private groups.
Master Pine Script (for Advanced Users) 🧑💻
- Custom Indicators & Strategies: Pine Script is TradingView’s proprietary programming language. Learn it to code your own custom indicators, strategies, and alerts.
- Backtesting: Develop and backtest your trading strategies directly on historical data to evaluate their profitability before risking real capital.
Utilize Paper Trading (Simulated Trading) 🎮
- Risk-Free Practice: Test your trading strategies and refine your skills in a simulated environment using virtual funds.
- Build Confidence: Gain experience with order types, entries, and exits without financial risk. Access it via the “Trading Panel” at the bottom of the chart.
Analyze Volume Profiles 📊
- Volume at Price: The Volume Profile tool shows the amount of trading volume at different price levels over a specified period.
- Identify Key Levels: This helps identify areas of significant support or resistance, where large amounts of buying or selling occurred.
Understand Different Data Feeds and Exchanges 🌐
- Exchange-Specific Data: Be aware that crypto prices can vary slightly between exchanges. TradingView allows you to select the data feed from specific exchanges (e.g., BTCUSDT on Binance vs. BTCUSD on Coinbase).
- Liquidity Insights: Analyzing different exchange feeds can give you insights into liquidity and potential arbitrage opportunities.
Explore Economic Calendar and News 📰
- Market Drivers: The built-in economic calendar highlights major economic events that could impact global markets, including crypto.
- Real-time News: Stay updated with real-time news feeds integrated directly into the platform, allowing you to react quickly to market-moving headlines.
Use the Bar Replay Feature ⏪
- Practice & Study: The “Bar Replay” tool allows you to simulate live price action by replaying historical data. This is an excellent way to practice identifying patterns, testing your reactions, and refining your entries/exits without the pressure of live trading.
Understand Pricing Tiers and Features 💲
- Free vs. Paid: While the free version offers substantial functionality, paid plans (Pro, Pro+, Premium) unlock more indicators per chart, more alerts, higher parallel chart connections, deeper historical data, and other advanced features crucial for serious traders.
- Evaluate Needs: Assess your trading style and frequency to determine which plan, if any, makes financial sense for your needs.
Customize Everything ✨
- Personalized Experience: TradingView allows extensive customization of chart colors, backgrounds, scales, indicator appearances, and drawing tool defaults. Create an environment that is visually appealing and conducive to your analysis.
- Save Chart Layouts: Save your customized chart layouts and templates to quickly apply them to different assets or market scenarios.
By treating TradingView as a dynamic analytical workbench rather than just a price ticker, you’ll unlock its full potential, significantly enhancing your crypto trading and investment journey.


