How to Trade Using Moving Averages
By Jason Miller – Crypto Writer 10.expert 🧠 Covering Bitcoin, altcoins, blockchain & Web3.
As a crypto writer and analyst, I often say that if technical analysis has a backbone, it’s the Moving Average (MA). Simple, yet profoundly effective, moving averages smooth out price data to reveal the underlying trend, cutting through the noise of daily volatility. They are indispensable tools for identifying trend direction, potential support and resistance levels, and even generating trading signals.
While they are “lagging indicators” (meaning they are based on past prices), their clarity makes them a favorite among traders of all levels. Let’s delve into how you can leverage moving averages in your crypto trading strategy.
Moving averages are fundamental to technical analysis, providing a clear visual representation of price action over time. They help traders identify the prevailing trend and anticipate potential shifts.
What is a Moving Average? Smoothing Out Price Action 📈
A moving average is a line on a chart that represents the average price of an asset over a specific period. By constantly updating with new price data, it creates a smoothed-out line that helps filter out short-term fluctuations and highlights the general direction of the trend.
Simple Moving Average (SMA) vs. Exponential Moving Average (EMA) ⚖️
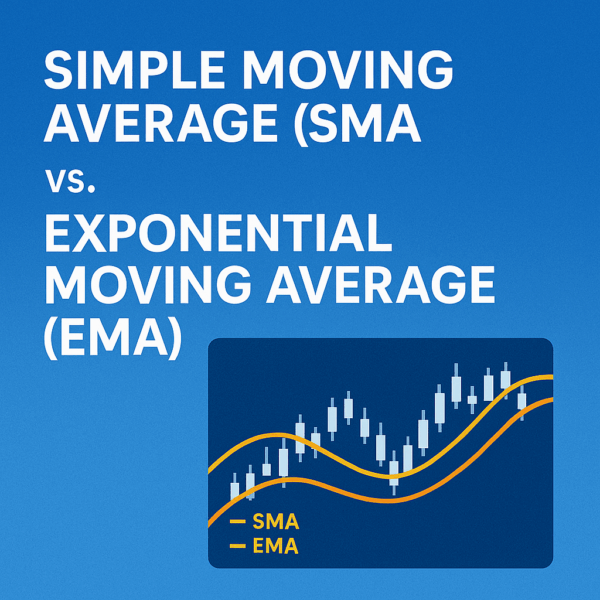
There are two main types of moving averages:
* Simple Moving Average (SMA): Calculates the average price over a set period by giving equal weight to each data point. It’s slower to react to new price changes, making it better for identifying longer-term trends.
* Exponential Moving Average (EMA): Gives more weight to recent prices, making it more responsive and faster to react to current market conditions. EMAs are often preferred by short-term traders for more timely signals.
Common Moving Average Periods for Crypto Trading 🗓️
The choice of period depends on your trading style and timeframe:
* Short-term (Day/Swing Trading): 5, 8, 10, 12, 20, 21, 26 periods (e.g., EMA for faster signals).
* Medium-term (Swing/Position Trading): 50, 55, 60 periods.
* Long-term (Trend Following/Investing): 100, 120, 200 periods (often SMA for broader market direction).
Experiment to find what works best for the asset and timeframe you’re trading.
Identifying Trends: Price Relation to the MA ⬆️⬇️
This is the most basic and powerful use of moving averages:
* Uptrend: When the price is consistently trading above a moving average (especially a longer-term one like the 50-period or 200-period MA) and the MA itself is sloping upwards.
* Downtrend: When the price is consistently trading below a moving average and the MA is sloping downwards.
* Sideways/Consolidation: When the price crosses back and forth over the MA, and the MA itself is relatively flat.
Dynamic Support and Resistance Levels 🛡️
Moving averages often act as dynamic support and resistance.
* In an Uptrend: A rising MA can serve as a support level. Traders might look for buying opportunities when the price pulls back and “bounces” off the MA.
* In a Downtrend: A falling MA can serve as a resistance level. Traders might look for selling opportunities when the price rallies and “rejects” the MA.
These are not fixed lines, but rather “zones” or areas of interest where price might react.
Moving Average Crossovers: Generating Buy/Sell Signals 🚥
A common strategy involves using two or more moving averages of different lengths. When they cross, it can signal a change in momentum or trend:
* Bullish Crossover (Buy Signal): A shorter-term MA crosses above a longer-term MA. This indicates strengthening bullish momentum.
* Bearish Crossover (Sell Signal): A shorter-term MA crosses below a longer-term MA. This indicates strengthening bearish momentum.
The Golden Cross: A Major Bullish Signal 🌟
A widely watched bullish crossover occurs when the 50-period MA crosses above the 200-period MA. This is often seen as a significant long-term bullish signal, suggesting a strong uptrend is emerging or confirming one already in progress.
The Death Cross: A Major Bearish Signal 💀
Conversely, the Death Cross occurs when the 50-period MA crosses below the 200-period MA. This is considered a significant long-term bearish signal, often preceding or confirming a downtrend.
Multiple Moving Average Strategy (Ribbons) 🎀
Some traders use a “ribbon” of several moving averages (e.g., 8, 13, 21, 34, 55, 89, 144 EMAs – Fibonacci numbers).
* Fanning Out: When all MAs are spread apart and pointing in the same direction, it indicates a strong trend.
* Converging: When MAs come closer together, it suggests consolidation or a weakening trend.
* Flipping: When the entire ribbon flips direction (e.g., all MAs cross over each other), it signals a strong trend reversal.
Price Crossovers (MA as Entry/Exit) 🎯
Another strategy is to use the price crossing a single moving average as an entry or exit signal:
* Buy Signal: Price crosses above a chosen MA (e.g., 20-period EMA).
* Sell Signal: Price crosses below a chosen MA.
This works best in trending markets and should be combined with other confirmations to avoid false signals in choppy markets.
Using Moving Averages for Confirmation and Filtering Noise ⚙️
Moving averages excel at providing context. If you get a buy signal from another indicator (like RSI), but the price is below a key moving average, it might be a weaker signal or a counter-trend trade with higher risk. Use MAs to filter out false signals generated by other indicators in ranging markets.
Combining MAs with Other Indicators 🤝
For more robust strategies, combine MAs with:
* RSI: Use MA to confirm the trend, then RSI for overbought/oversold conditions within that trend (e.g., in an uptrend, buy when RSI pulls back to 40 and price bounces off an EMA).
* MACD: Both are trend-following indicators, but MACD also shows momentum, confirming MA crossovers.
* Volume: Increased volume on MA crossovers or bounces adds conviction to the signal.
Limitations of Moving Averages: Lagging Nature 🕰️
Remember that MAs are lagging indicators. They reflect past price action and don’t predict the future. In fast-moving or choppy markets, they can generate false signals or react too slowly. They are most effective in clearly trending markets.
Adjusting Timeframes: Zoom In, Zoom Out 🔍
Apply MAs to various timeframes. A 50-day SMA might show a long-term trend, while a 20-period EMA on a 4-hour chart provides short-term tactical signals. Always consider the bigger picture from higher timeframes.
Risk Management: Never Trade Without It ⚠️
Even with the clearest MA signals, the crypto market is volatile. Always define your stop-loss and take-profit levels before entering a trade. Moving averages can help you determine logical places for these (e.g., placing a stop-loss just below a key MA support).
Mastering moving averages provides a solid foundation for any crypto trader. By understanding their types, common applications, and how to combine them with other tools, you can significantly enhance your ability to identify trends, manage risk, and make more informed decisions in the dynamic crypto landscape.


